Researchers at IBM, the Partnership on AI, and several leading universities have catalogued hundreds of metrics for quantifying AI risk, covering everything from fairness and robustness to explainability and privacy. Yet most AI risk assessments conducted by U.S. organizations today still produce the same output: a consultant’s report labeling systems as “High,” “Medium,” or “Low” risk. The gap between what can be measured and what actually gets measured is one of the most consequential blind spots in AI governance. This article breaks down the two dominant approaches to AI risk scoring, qualitative and quantitative, explains where each succeeds and fails, and makes the case for why the organizations getting AI governance right are using both.
What AI Risk Scoring Actually Means (and Why It Matters)
AI risk scoring is the process of assigning a value, whether a label, a number, or a composite metric, to the risks associated with an AI system. The score reflects some combination of likelihood and severity across multiple dimensions: accuracy, fairness, security, privacy, transparency, robustness, and societal impact.
The purpose is not academic. Risk scores drive concrete decisions. They determine which AI systems receive additional oversight before deployment, how resources are allocated across a portfolio of AI projects, whether a system requires human-in-the-loop controls, and whether the organization can demonstrate due diligence to regulators, auditors, and customers. Under ISO/IEC 42001, organizations must perform both AI risk assessments (Clause 6.1.2) and AI system impact assessments (Clause 6.1.4). The NIST AI RMF’s Measure function explicitly calls for quantitative, qualitative, or mixed-method tools to analyze and monitor AI risk. Neither framework prescribes a single scoring methodology, which means the choice between approaches falls to the organization.
Qualitative AI Risk Scoring: How It Works and Where It Fits
A qualitative risk assessment assigns descriptive ratings to AI risks based on expert judgment, structured questionnaires, and scenario analysis. The output is typically a risk matrix where each identified risk receives a likelihood rating (rare, unlikely, possible, likely, almost certain) and an impact rating (negligible, minor, moderate, major, severe). These ratings combine into an overall risk tier.
The process usually starts with a cross-functional workshop or structured questionnaire. Subject matter experts from engineering, legal, compliance, product, and ethics teams evaluate each AI system against predefined risk categories: accuracy and reliability, algorithmic bias and fairness, data quality and provenance, transparency and explainability, security and adversarial robustness, privacy, societal impact, and third-party dependencies.
Strengths of Qualitative Scoring
Speed and accessibility. Qualitative assessments can be completed in days or weeks, not months. They do not require specialized tooling, extensive historical data, or deep technical expertise in machine learning metrics. This makes them the practical starting point for organizations early in their AI governance journey.
Breadth of coverage. Qualitative methods can capture risks that resist numerical measurement: reputational damage from a biased system, erosion of customer trust, regulatory uncertainty in emerging jurisdictions, or ethical concerns about how an AI system affects vulnerable populations.
Contextual richness. Expert judgment accounts for organizational context, industry dynamics, and deployment circumstances that a purely metric-driven assessment would miss. A facial recognition system deployed at a retail checkout poses different risks than the same technology deployed in law enforcement, even if the technical performance metrics are identical.
Limitations of Qualitative Scoring
Subjectivity and inconsistency. Two assessors evaluating the same AI system frequently assign different ratings. There is no standardized calibration, no repeatability guarantee, and no way to compare scores across teams or time periods.
Point-in-time snapshots. Qualitative assessments capture conditions at the moment the workshop happens. AI systems change continuously. A risk rating from six months ago may bear little resemblance to current conditions.
Limited actionability for engineering teams. A rating of “high bias risk” tells engineers that a problem exists but not where or how severe it is. Without specificity on which demographic groups are affected and by what margin, remediation becomes guesswork.
Quantitative AI Risk Scoring: Metrics, Models, and Measurement
A quantitative AI risk assessment computes well-defined metrics that assign specific numerical values to risk dimensions. Rather than labeling a system’s fairness risk as “medium,” a quantitative approach calculates that the system’s disparate impact ratio across racial groups is 0.73 (below the 0.80 threshold that triggers concern under U.S. employment law) and that its equalized odds differential is 0.12.
Risk Dimensions That Can Be Quantified
Accuracy and reliability. Standard classification metrics (precision, recall, F1 score, AUC-ROC) and regression metrics (RMSE, MAE) measure whether the model produces correct outputs. Calibration metrics assess whether predicted probabilities match observed frequencies.
Fairness and bias. Disparate impact ratio, equalized odds, demographic parity, equal opportunity difference, and predictive parity each capture a different mathematical definition of fairness. IBM’s AI Fairness 360, Microsoft’s Fairlearn, and the Aequitas toolkit provide open-source implementations.
Robustness and adversarial resilience. Metrics measure how much an input must be perturbed before the model’s output changes. IBM’s Adversarial Robustness Toolbox provides standardized tests for evasion, poisoning, and extraction attacks.
Explainability. SHAP values, LIME explanations, and feature importance scores quantify how much each input variable contributes to a prediction. Explanation fidelity metrics measure whether the explanation accurately reflects the model’s decision process.
Privacy. Membership inference attack success rates measure whether an attacker can determine if a specific record was in the training data. Differential privacy epsilon values quantify the mathematical privacy guarantee.
Model drift. Population stability index (PSI) and Kolmogorov-Smirnov statistics measure distribution shifts since training. A 2025 study in the Journal of the American Medical Informatics Association found that fairness metrics can drift even when overall performance remains stable, a phenomenon the researchers termed “fairness drift.”
Strengths of Quantitative Scoring
Objectivity and repeatability. The same metric computed on the same system by different teams produces the same result. This eliminates subjectivity and enables comparison across systems, time periods, and organizations.
Actionable specificity. A quantitative score tells engineering teams exactly what is wrong and by how much, giving engineers a precise remediation target.
Continuous monitoring capability. Metrics can be computed automatically, enabling real-time dashboards, automated alerts, and trend analysis.
Regulatory alignment. The EU AI Act’s Article 9 requires risk management that is “continuous and iterative” with risk estimation and evaluation. Quantitative scoring satisfies this directly.
Limitations of Quantitative Scoring
Narrow focus. Each metric measures one specific aspect. A model can score well on every individual metric and still present risks that fall between the cracks: reputational risk, contextual appropriateness, or emerging regulatory exposure.
Metric selection bias. The choice of fairness metric is itself a value judgment. Demographic parity and equalized odds can be mathematically incompatible, a result proven by Chouldechova (2017) and known as the impossibility theorem.
Data dependency. Quantitative assessment requires labeled test data, demographic annotations, and production monitoring infrastructure that many organizations lack.
Resource intensity. Building a quantitative scoring pipeline requires specialized tooling, data engineering, and ML expertise.
Qualitative vs. Quantitative AI Risk Scoring: Side-by-Side
| Dimension | Qualitative | Quantitative |
|---|---|---|
| Output format | Descriptive ratings (High/Medium/Low) | Numerical scores and metrics |
| Objectivity | Subjective; varies by assessor | Objective; repeatable results |
| Speed to implement | Days to weeks | Weeks to months |
| Risk coverage breadth | Broad; captures context and nuance | Narrow; focused on measurable dimensions |
| Actionability for engineers | Low; signals existence of risk | High; pinpoints specific issues |
| Continuous monitoring | No; point-in-time snapshots | Yes; automated and real-time capable |
| Data requirements | Minimal; relies on expert judgment | Extensive; requires labeled data and tooling |
| Cost and complexity | Low to moderate | Moderate to high |
| Regulatory alignment | Partial; satisfies identification | Strong; satisfies measurement and monitoring |
| Best suited for | Early-stage governance, broad mapping | Mature programs, technical dimensions |
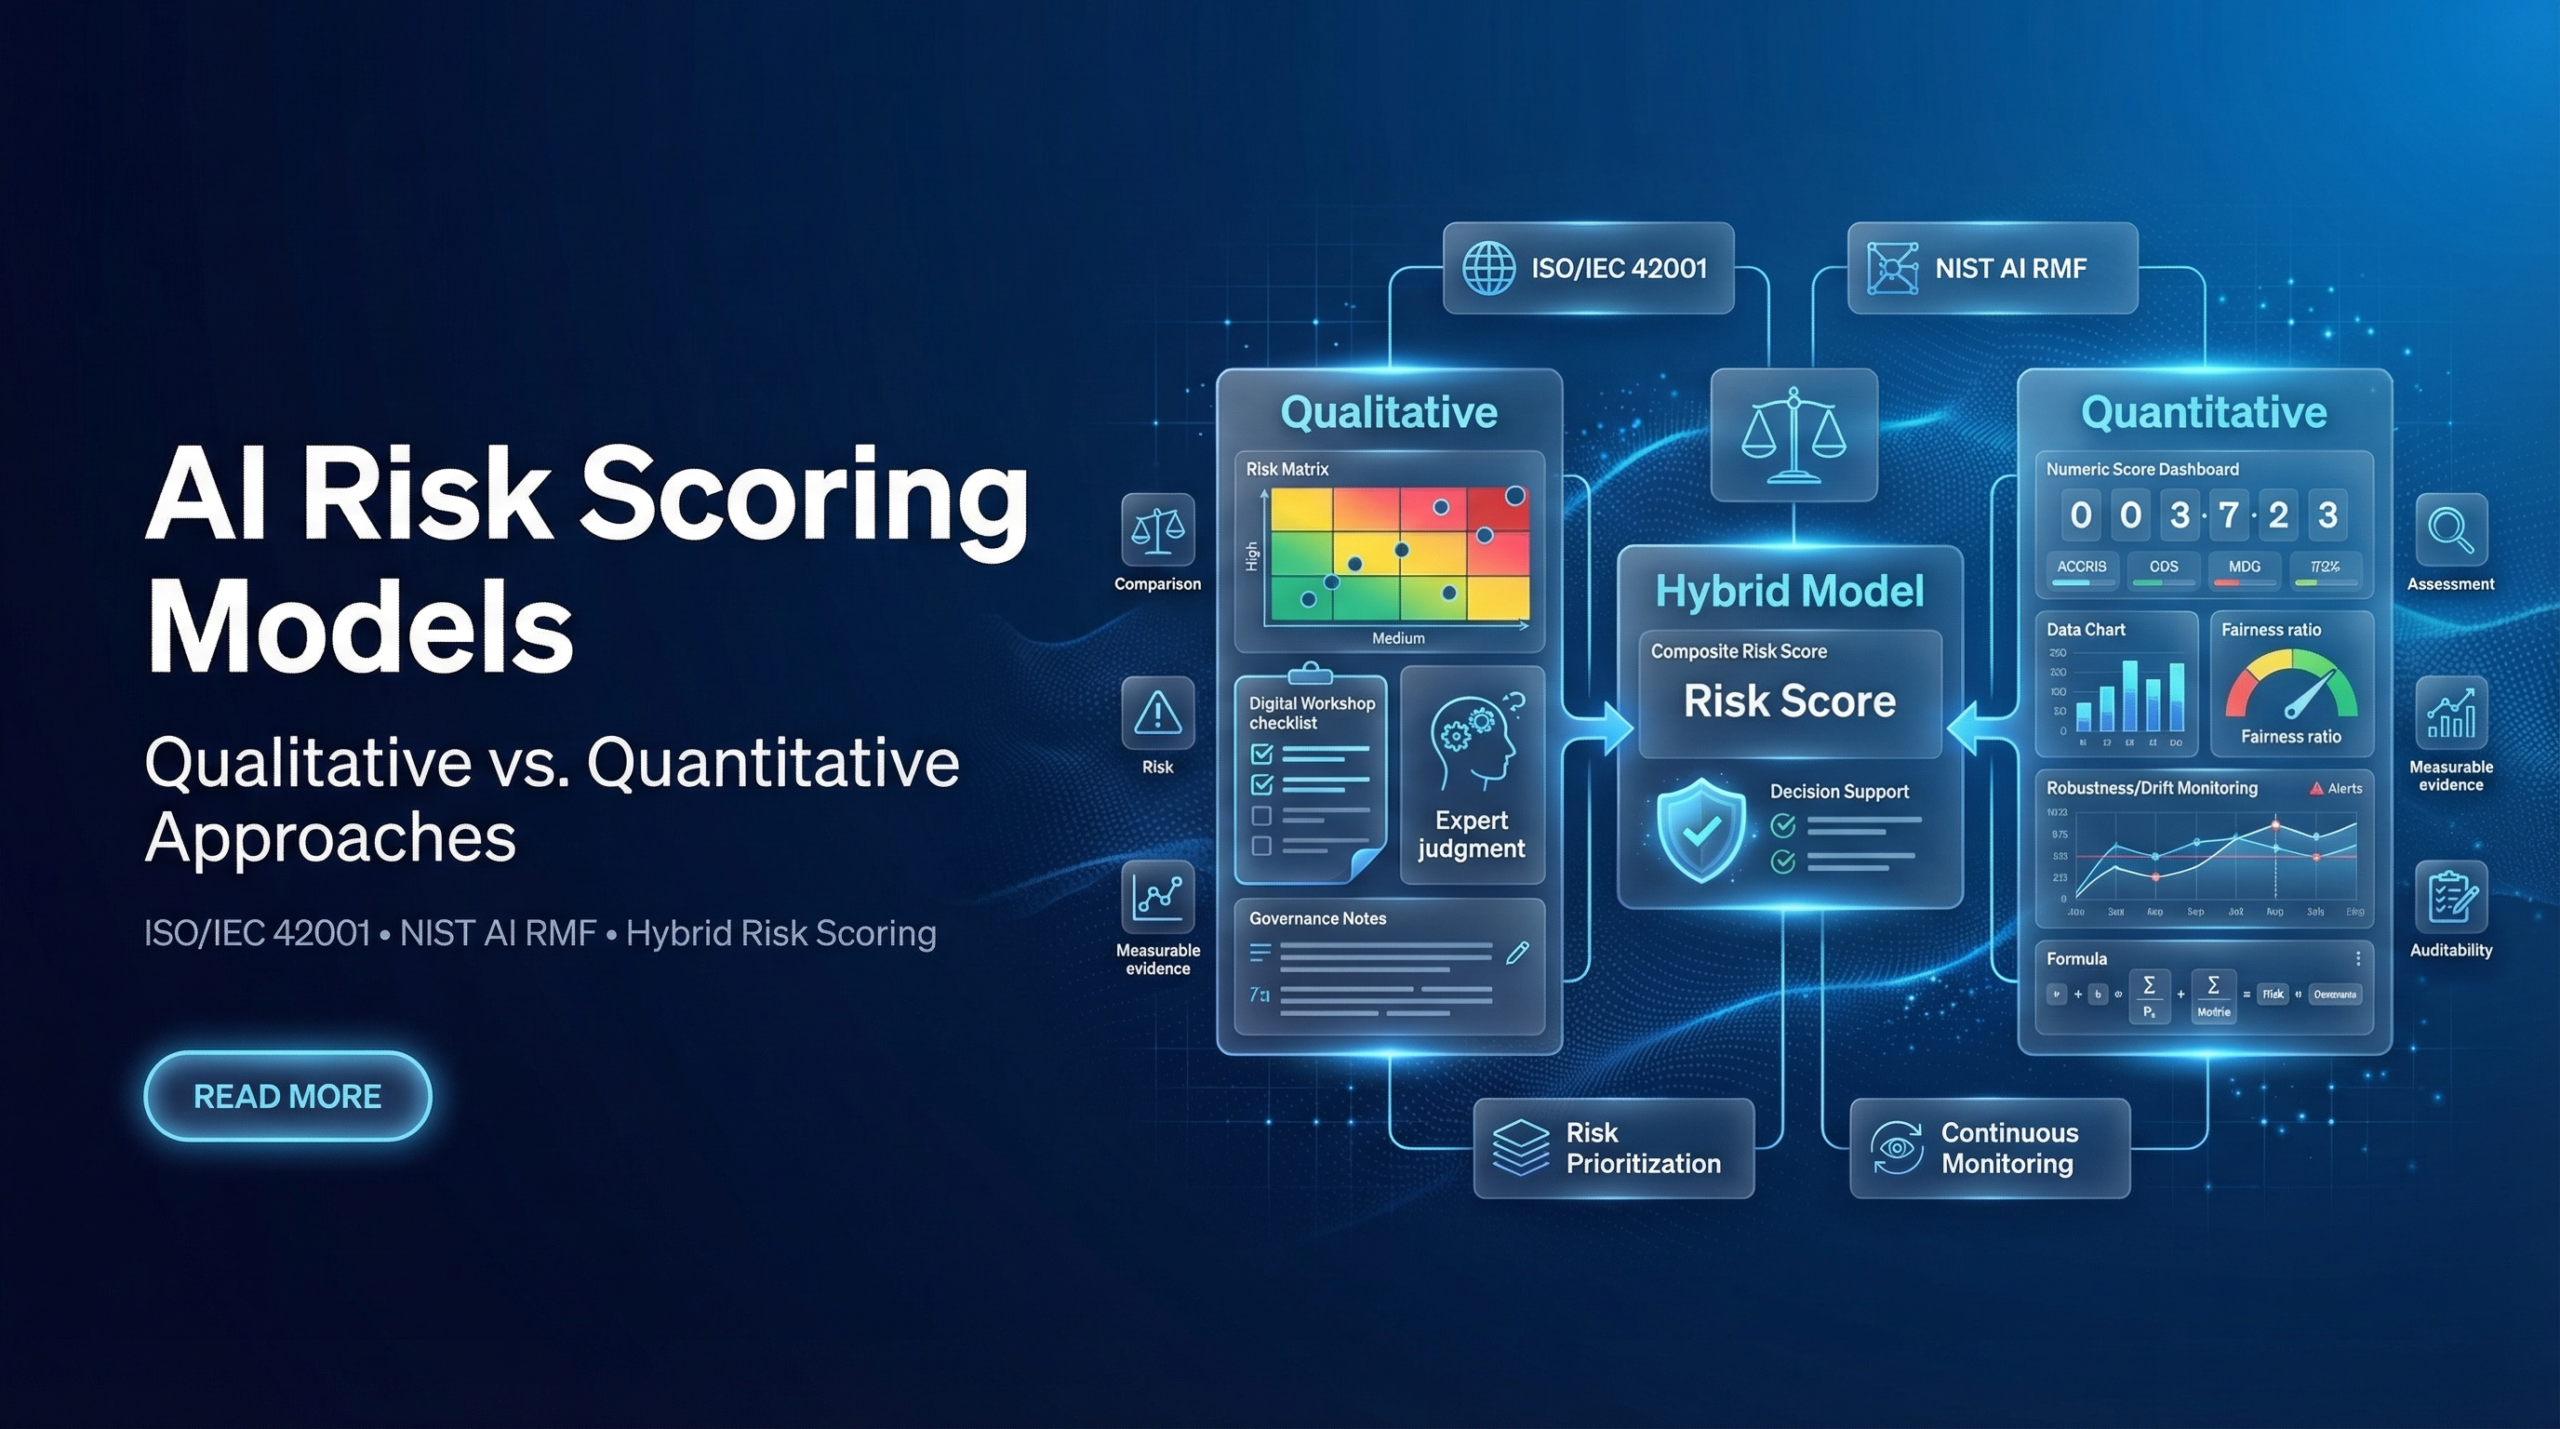
The Hybrid Approach: Why the Best Programs Use Both
The qualitative vs. quantitative debate creates a false dichotomy. The most effective AI risk scoring programs use both methods in a structured, complementary sequence. Think of it like a medical examination: the doctor asks qualitative questions (“How are you feeling? Where does it hurt?”) and runs quantitative tests (blood work, imaging, vital signs). Neither alone gives the full picture.
Practitioner insight: One leader who guided Zendesk to ISO 42001 certification recommended using a qualitative AI risk assessment as a structured questionnaire during the MAP phase, then applying quantitative measurement for each specific risk identified. Collecting context within a structured format is easier to evaluate than an unstructured collection of documents.
Phase 1: Qualitative Risk Mapping (The MAP Stage)
Use structured questionnaires and expert workshops to inventory all AI systems and identify relevant risk categories. The output is a qualitative risk register documenting each system, its purpose, data sources, stakeholders, and applicable risk categories.
Phase 2: Quantitative Risk Measurement (The MEASURE Stage)
For each risk identified in Phase 1, determine whether a quantitative metric exists and whether the organization has the data to compute it. If qualitative assessment flagged fairness risk for a lending model, the quantitative phase computes disparate impact ratios and equalized odds differentials. If it flagged robustness concerns, run adversarial attack simulations.
Phase 3: Composite Risk Scoring
Combine qualitative ratings for dimensions that resist quantification (reputational risk, ethical alignment, regulatory uncertainty) with quantitative scores for measurable dimensions (accuracy, fairness, robustness, drift). Weight each dimension according to risk appetite and deployment context.
Phase 4: Continuous Monitoring and Reassessment
Quantitative metrics run continuously in production. Qualitative reassessments occur on a scheduled basis or when significant changes happen. The two feedback loops reinforce each other: quantitative anomalies trigger qualitative investigation, and qualitative concerns drive new metrics.
How Risk Scoring Maps to ISO/IEC 42001 and NIST AI RMF
ISO/IEC 42001 requires AI risk assessments under Clause 6.1.2 that evaluate likelihood and impact, and AI system impact assessments under Clause 6.1.4 that evaluate consequences for individuals and society. The standard requires documented processes and reproducible results, which pushes toward quantitative methods for measurable dimensions.
The NIST AI RMF’s Measure function explicitly calls for “quantitative, qualitative, or mixed-method tools, techniques, and methodologies.” The framework’s trustworthiness characteristics map directly to dimensions where quantitative metrics are well-established. NIST has published crosswalk documentation showing how Measure subcategories align with ISO 42001 Clauses 8.2 through 8.4.
The practical takeaway: if you are building toward ISO 42001 certification or NIST AI RMF alignment, demonstrate both qualitative breadth and quantitative depth.
Building a Risk Scoring Program: Practical Steps
- Start with a qualitative inventory. Document every AI system with its owner, purpose, data sources, and deployment context. Run a structured risk identification workshop aligned with ISO 42001 Annex C risk sources.
- Establish quantitative baselines for high-priority systems. Deploy open-source toolkits: AI Fairness 360 for bias, Adversarial Robustness Toolbox for security, AI Explainability 360 for transparency. Document baseline scores before deployment.
- Define thresholds and escalation rules. A disparate impact ratio below 0.80, a PSI above 0.20, or an adversarial perturbation success rate above 10% might each require escalation to a risk committee.
- Build composite scores for portfolio prioritization. Create a scoring formula combining qualitative tiers and quantitative metrics weighted by industry and regulatory context.
- Implement continuous monitoring for production systems. Deploy drift detection, fairness monitoring, and performance tracking with automated alerts.
- Schedule periodic qualitative reassessments. Quarterly reviews for changes in regulations, deployment contexts, stakeholder expectations, or third-party AI providers.
Common Mistakes in AI Risk Scoring
Relying exclusively on qualitative assessments. A risk matrix that labels everything High, Medium, or Low satisfies identification but not measurement. Auditors under ISO 42001 will ask what evidence supports that classification.
Treating quantitative metrics as complete risk coverage. A model can achieve perfect scores on every fairness metric and still create harm in deployment. Metrics do not capture contextual factors or emerging regulatory exposure.
Choosing the wrong fairness metric. The impossibility results mean no single metric captures all notions of fairness. Organizations must make explicit, documented choices about which definition applies to each use case.
Scoring once and forgetting. Models drift. Fairness metrics that were acceptable at deployment can degrade over months. Risk scoring must be continuous for quantitative dimensions and periodic for qualitative ones.
Scoring Is the Foundation, Not the Finish Line
Risk scoring converts abstract AI governance principles into concrete, prioritized actions. Qualitative methods give you breadth, speed, and contextual understanding. Quantitative methods give you precision, objectivity, and continuous monitoring capability. The organizations building durable AI governance programs use both in a structured sequence: qualitative to map the landscape, quantitative to measure what matters, and composite scores to drive resource allocation and executive decisions.
The clearest starting point is to take your existing AI inventory and run a structured qualitative assessment against the risk categories in ISO 42001 Annex C, then identify the top three risk dimensions where quantitative measurement would have the highest impact.
GAICC offers ISO/IEC 42001 Lead Implementer training that covers both qualitative and quantitative risk assessment methodologies as part of building a complete AI Management System. Explore the program to strengthen your AI risk scoring capabilities.